That MICA Vibe
What does this mean for the MICA community? What does it mean to record this pulse? What are the factors that go into measuring this? Similar to a human body, the MICA community has a pulse that we can attempt to record and understand through placing sensors at unique locations on campus. The pulse tells us not only about moments of activity but also moments to rest and transition, ultimately archiving a non-linear narrative of what it’s like to be here.
My Role
Graphic Designer
Timeline
16 weeks
Tools Used
Figma, Photoshop,
Illustrator, Github,
Unity
The project was featured on:
Adobe Creative Cloud
Designboom
AIGA 50 Books | 50 Covers 2019
Overview
Our Goal
The goals of this project are to present an interesting, safe, and open way of collecting data as a precedent to more data-driven works in the future, how can we redefine the scope of data collection to exist beyond surveys and site trackers? As a result, we have chosen to collect data in non-homogenous ways (pop-up events, 24/7 sensor station) to diversify the types and reactions to data collection. More importantly, how can we coax a playful engagement with the MICA community in an era of data paranoia? Seeing the people behind data collection humanizes the often alienated process of data collection, and perhaps art and design may help us foster a better relationship between people and digital interfaces.
Additionally, we are exploring the longevity and life cycle of our sensors/data. Since our data is collected from MICA students, it should belong to MICA students. When our current project is finished, we will open up this collection of sensors and data points to future MICA students to pursue data-driven projects.
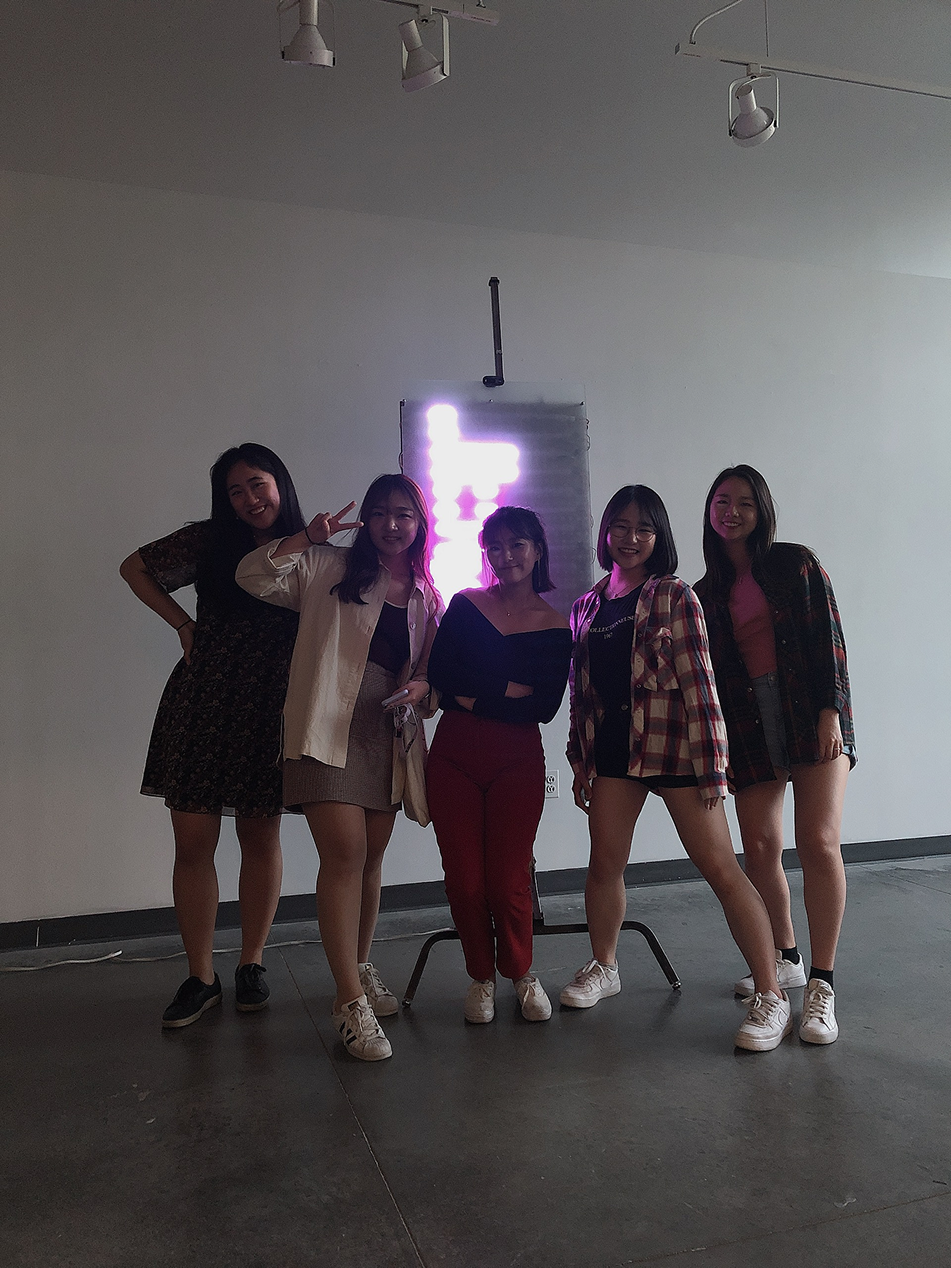
The MICAVIBE project was wholly designed and built by students in the Spring 2019 Interactive Spaces class in the Interactive Arts department at MICA. The class was: Blythe Thea Williams, Cheng Qin, Gary Zhang, Heerim Shin, Jess Sanders, Laurain Park, Miri Kim, Peter Turnbull, Serah Choi, and Yeri Choi.
Dione Lee was the teaching assistant and Adam Bachman was the instructor. The code for the project is at http://github.com/micais2019/interactive-spaces and the code for this site is at https://github.com/micais2019/MICAVIBE.
Design Process

Research
Brainstorm
Idea
Process
Hardware and software
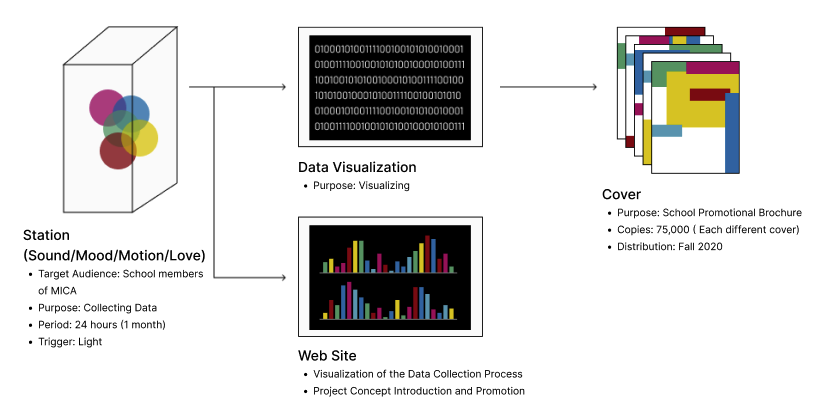
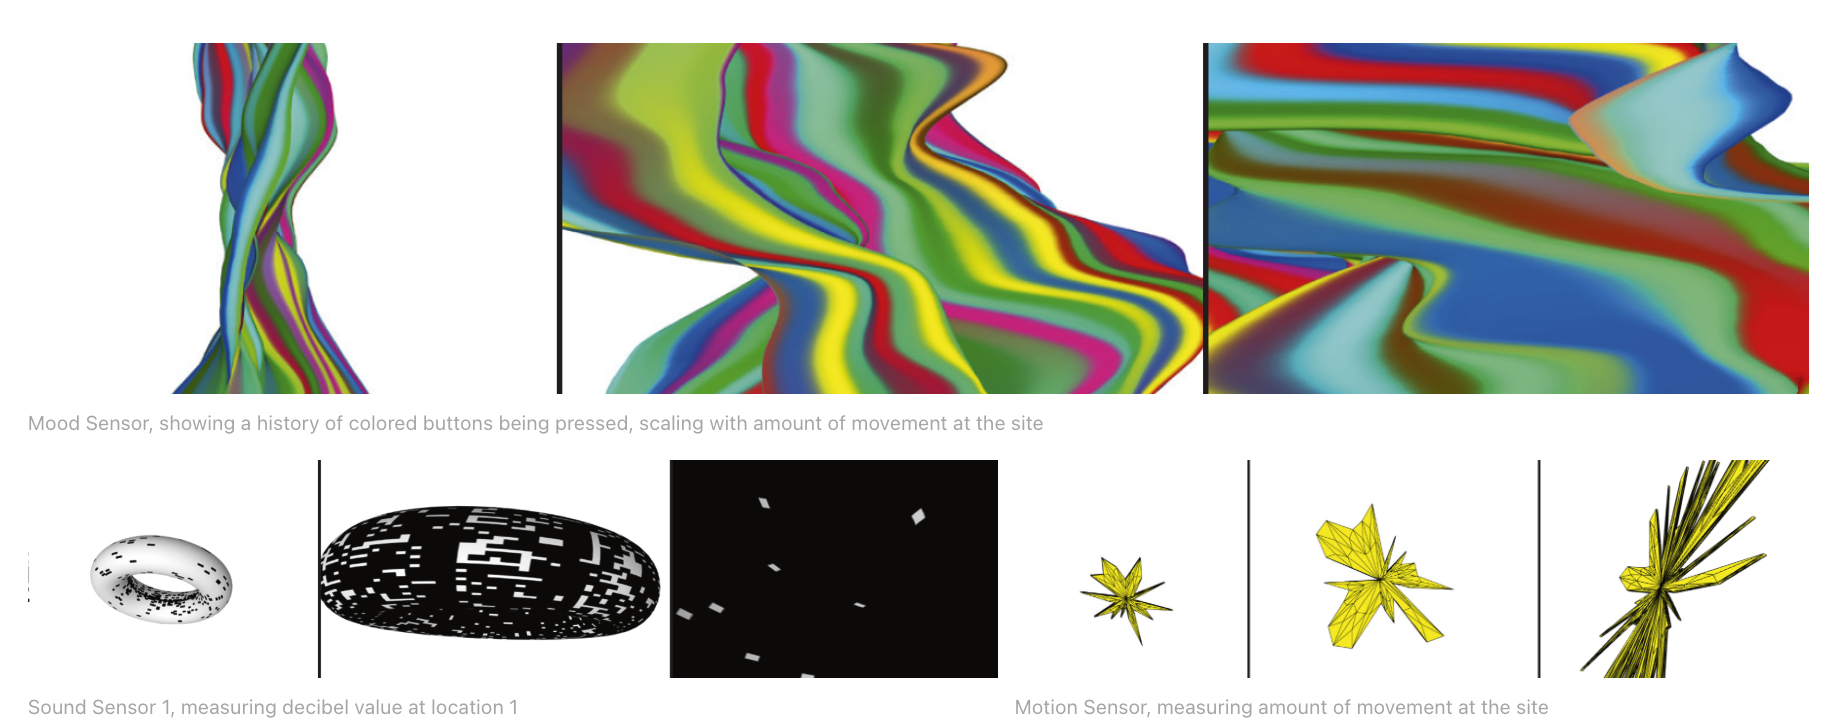
We began by building physical data-collection stations and developing custom code that could capture students’ responses in real time. To explore different emotional and sensory inputs, we designed four distinct data stations: Mood, Sound, Motion, and Love. Each station invited students to interact voluntarily, allowing us to gather diverse forms of qualitative and quantitative data directly from the MICA community.


Final output
Hardware and software
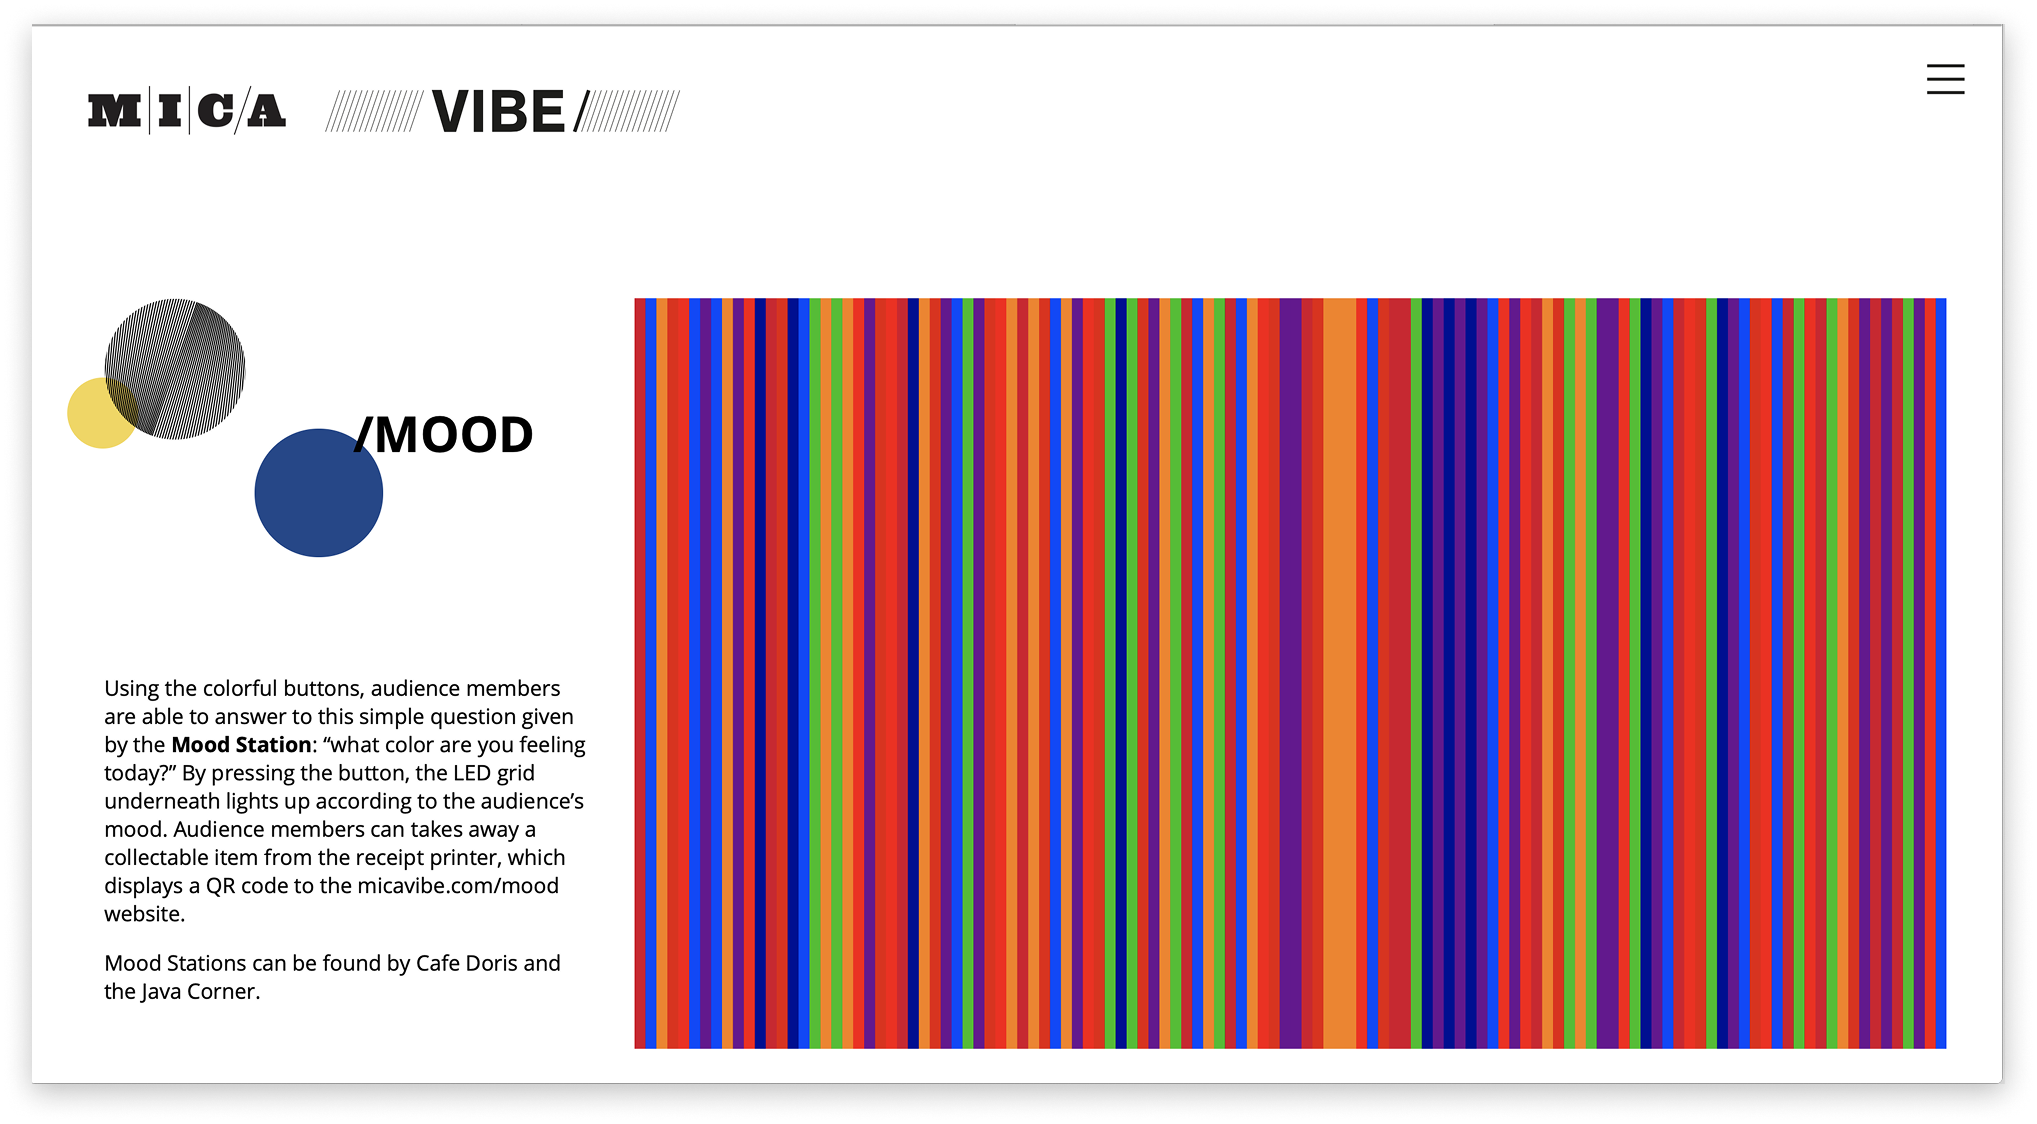
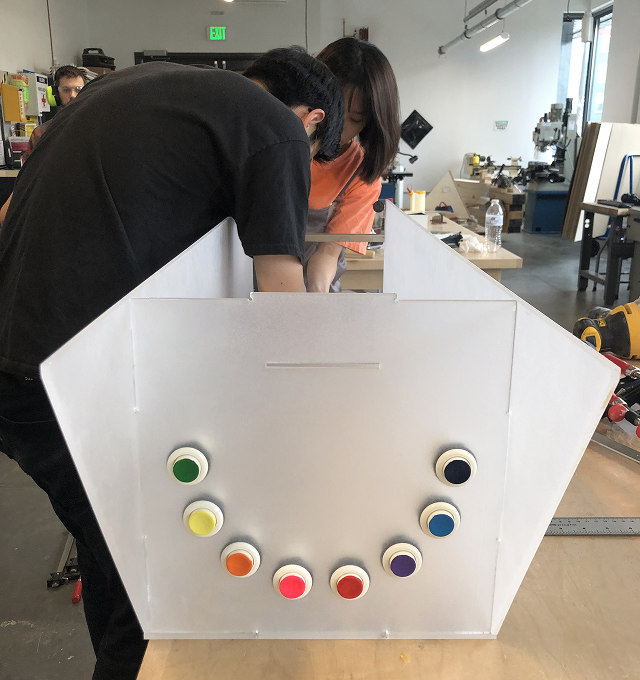
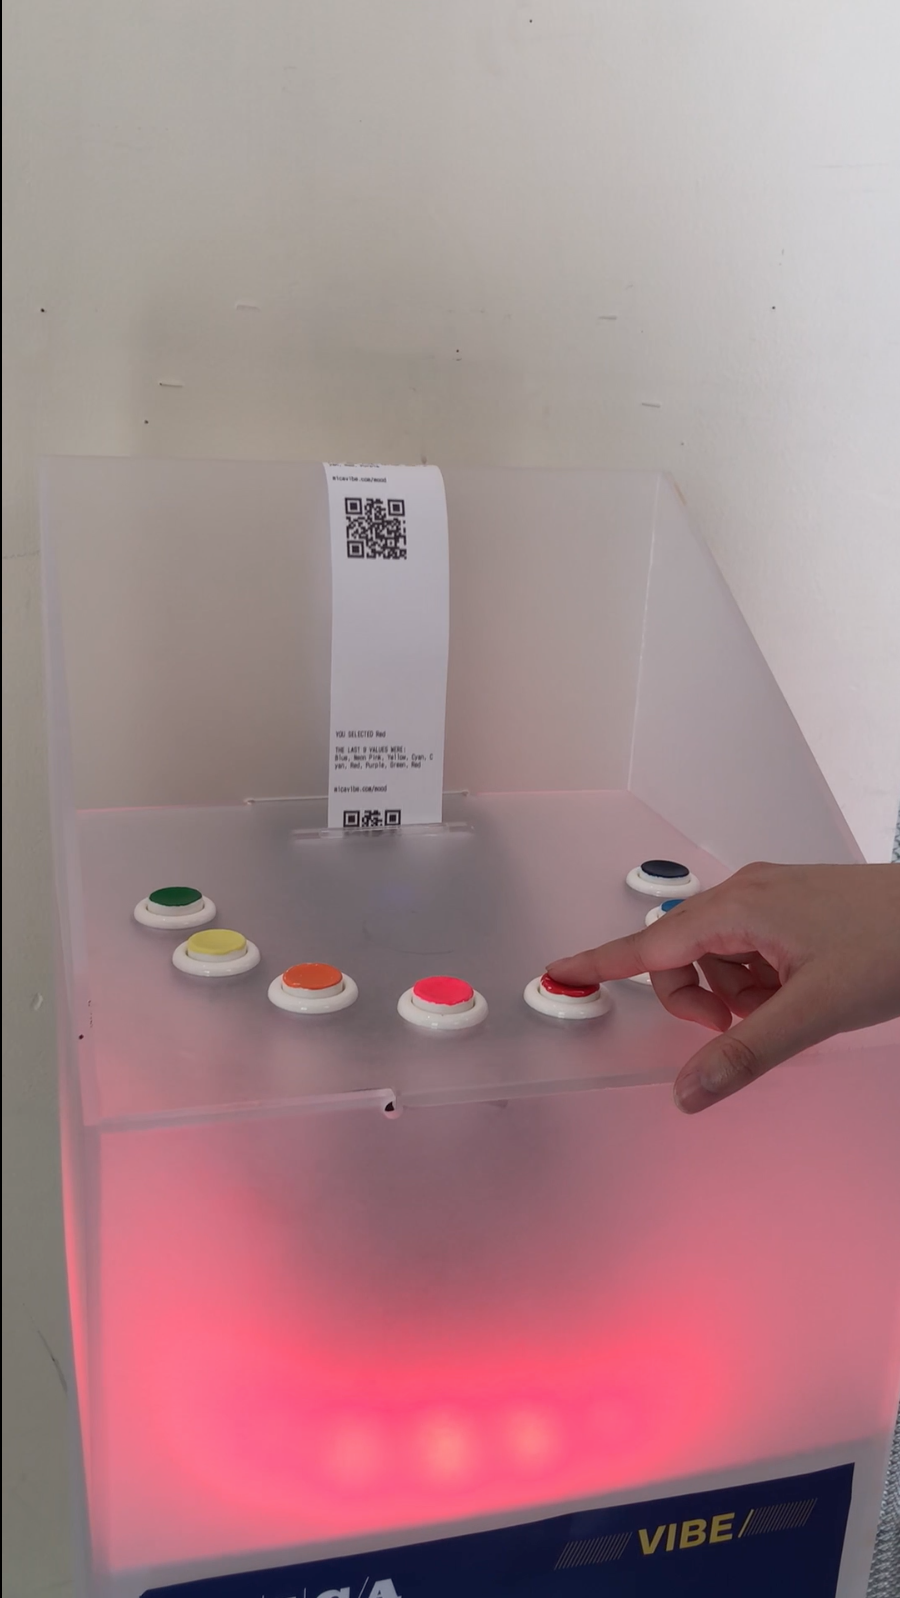
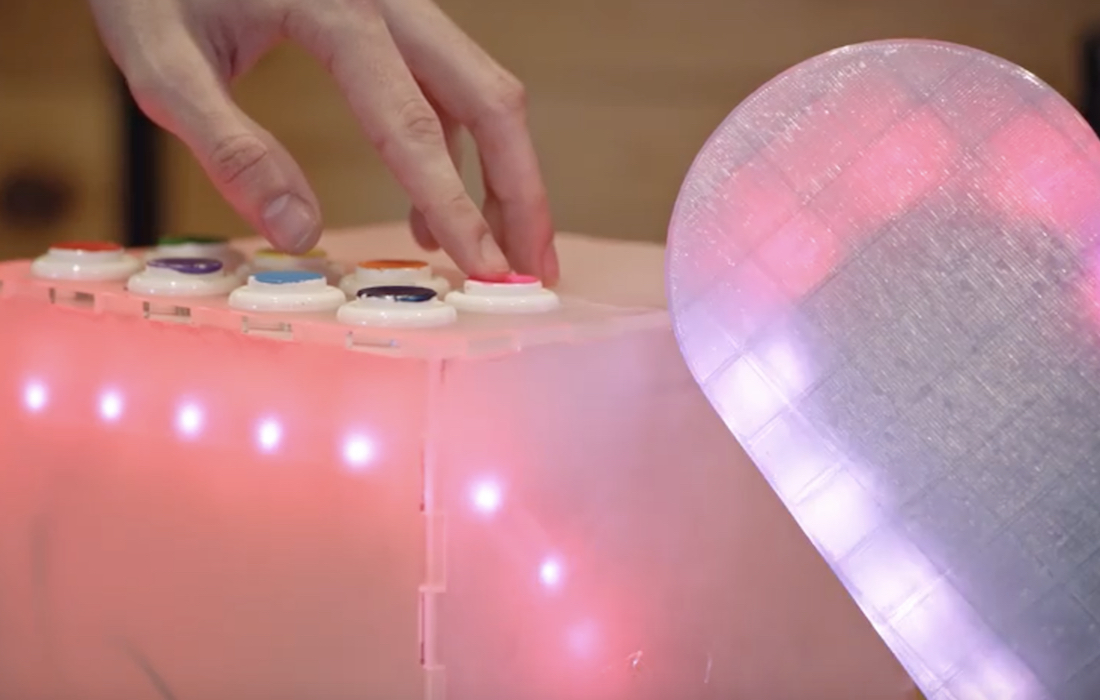
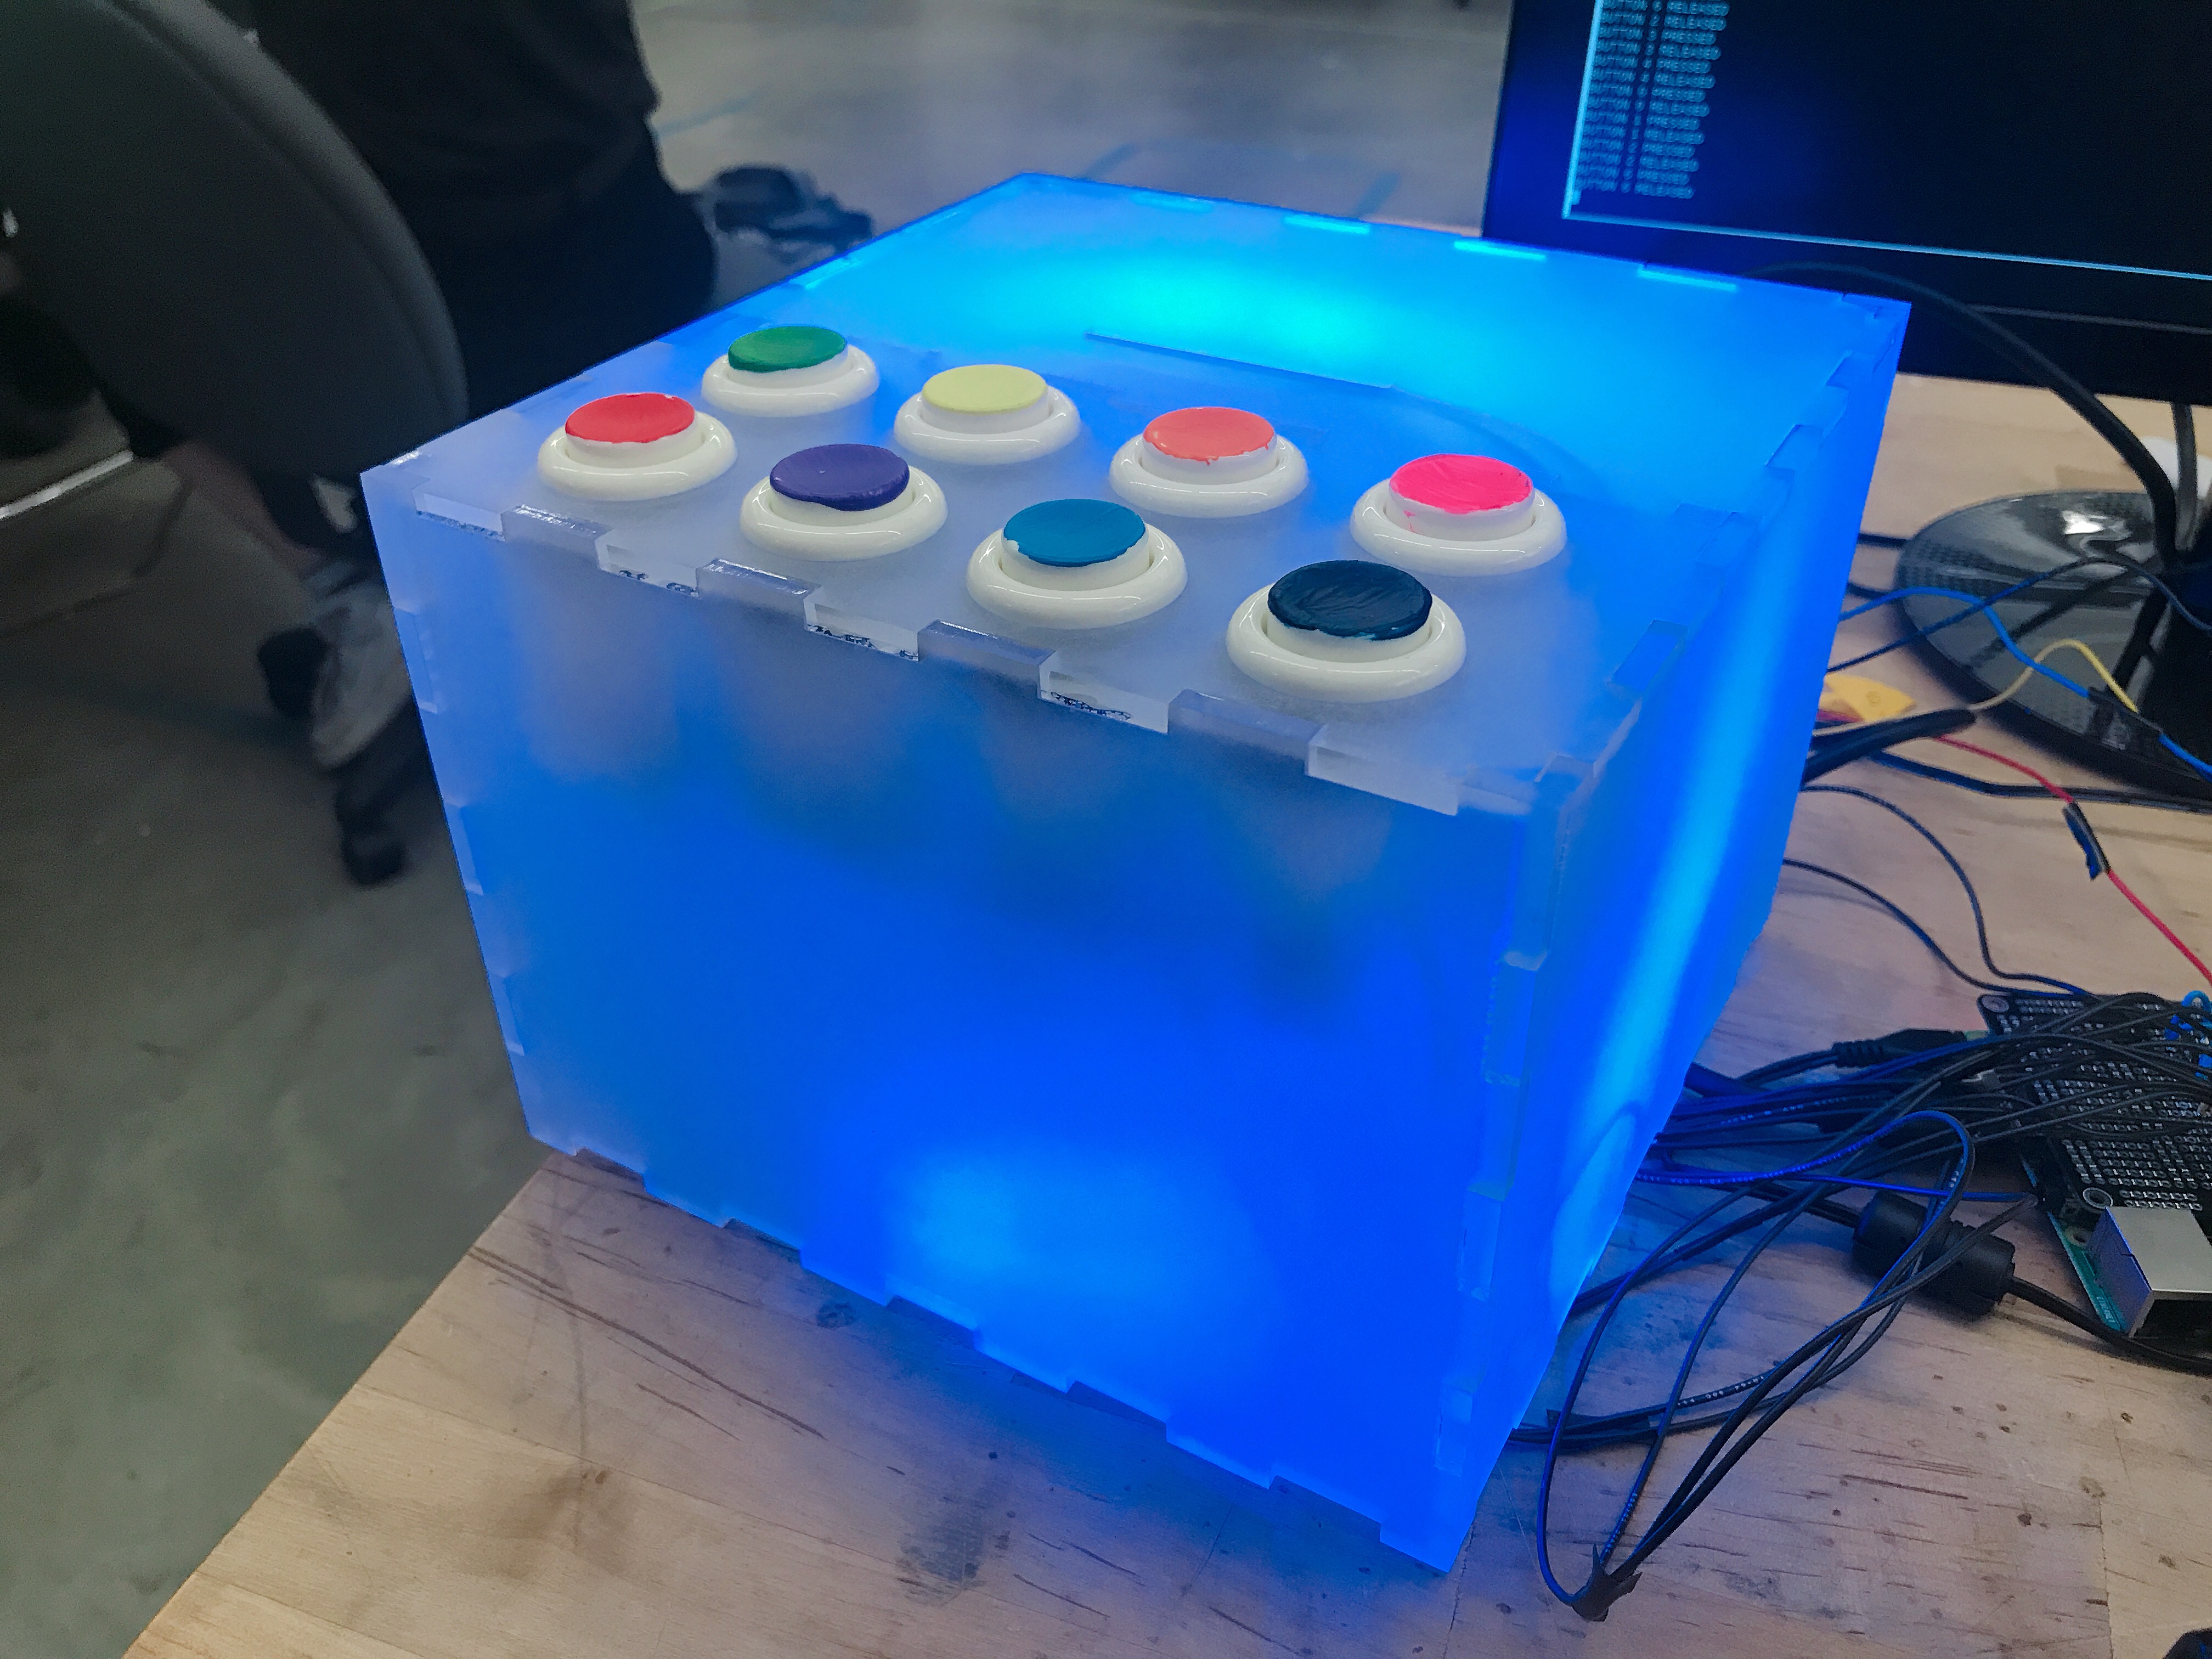
Mood Station
A mood station was installed at Cafe Doris, designed with simple buttons and colors. It posed a straightforward question: "What color are you feeling today?", allowing MICA students to express their feelings through color selection. The collected data was then visualized and transformed into a cover material, representing the emotional trends of the participants.

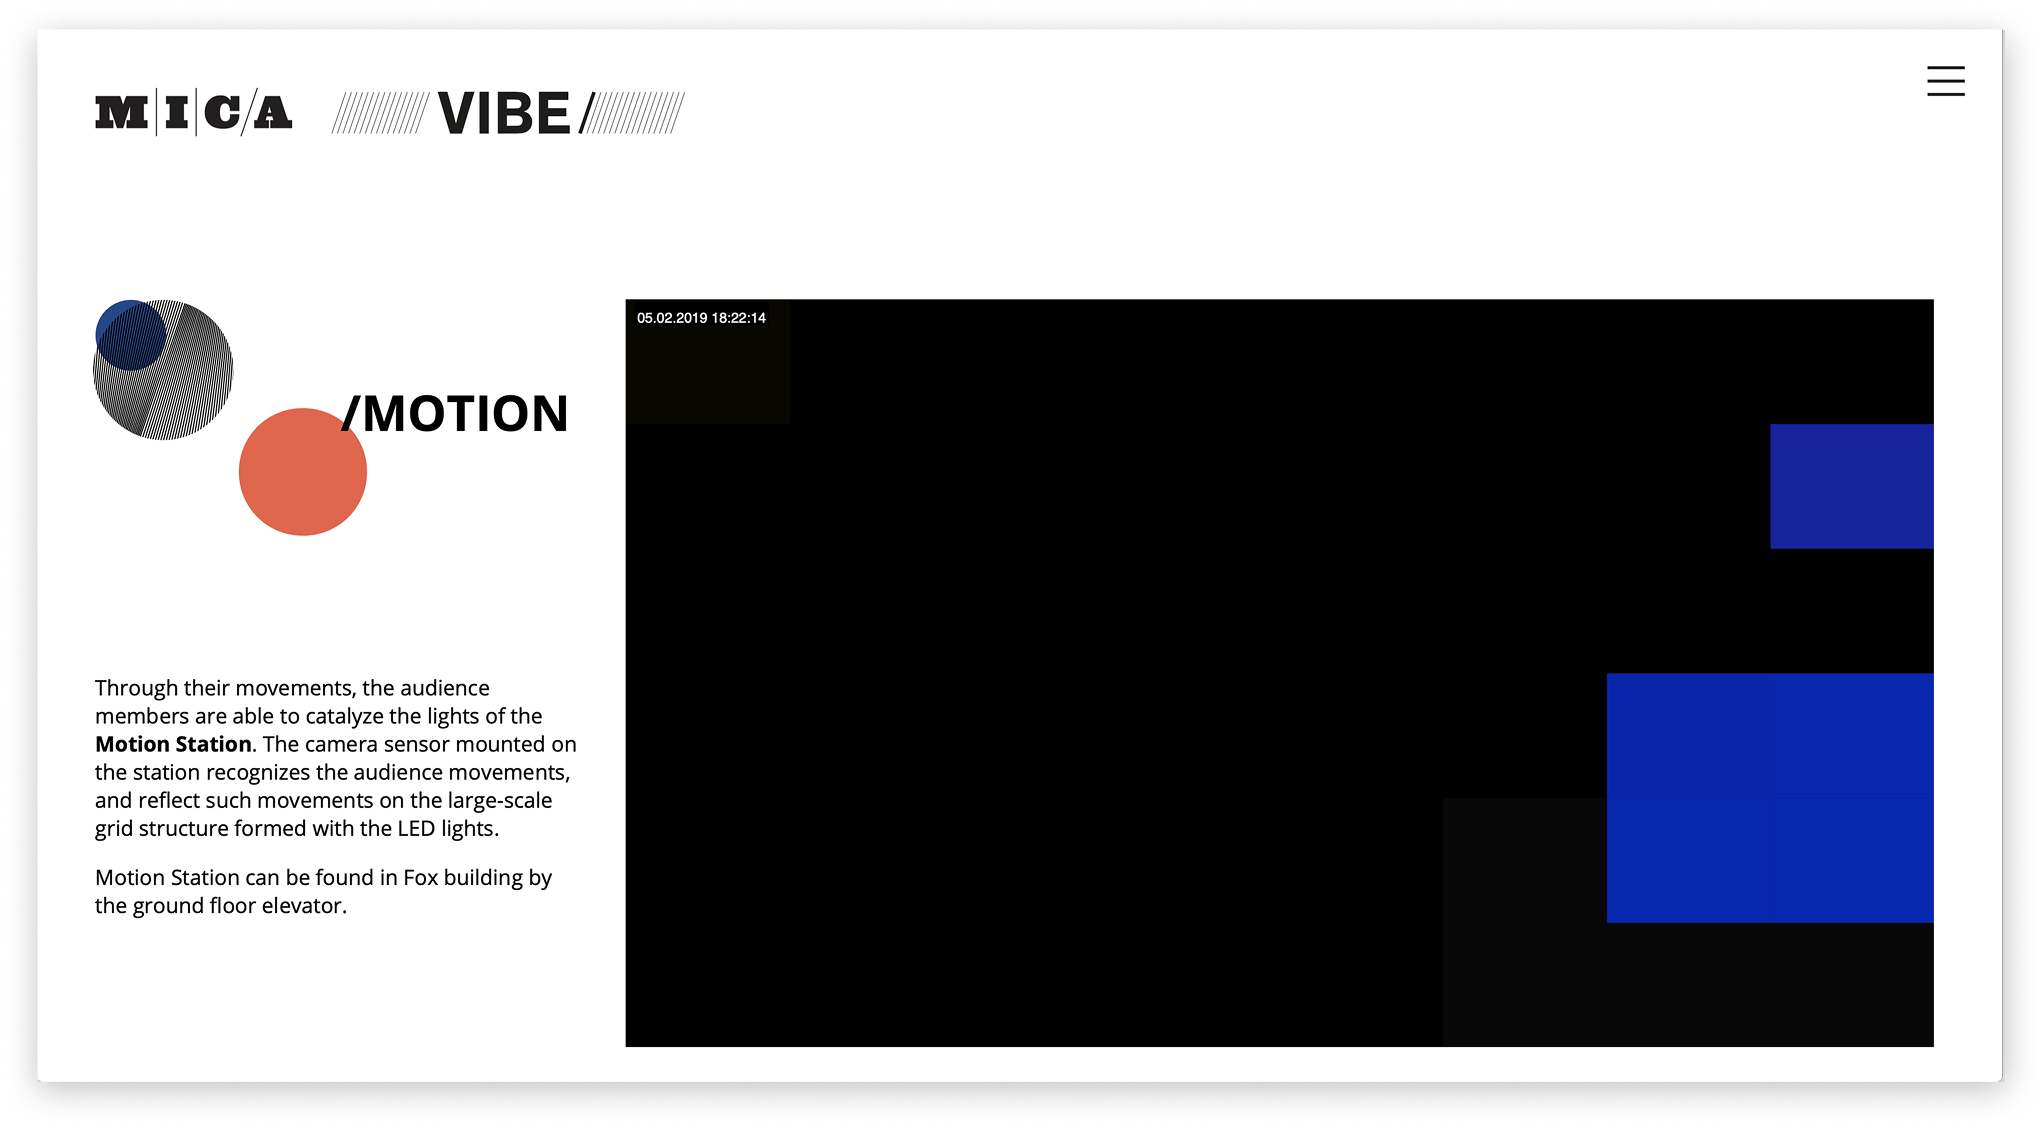
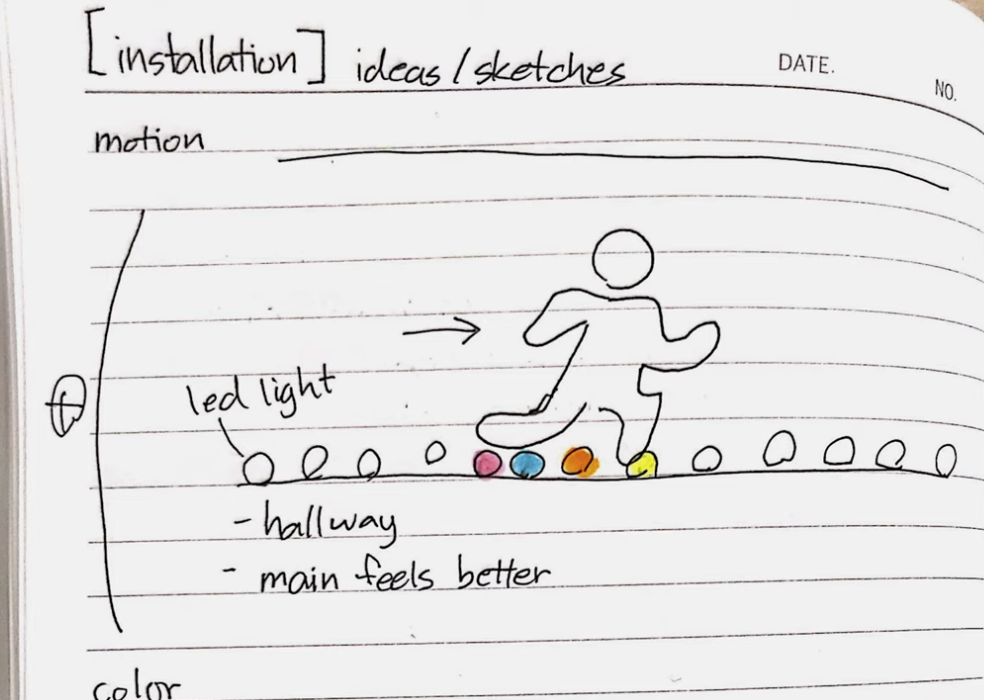
Motion Station
The purpose of the motion station is to collect movement data from MICA students. It was installed in the Fox Building, a high-traffic area for students, and utilized a camera sensor to capture their movements, collecting movement data. The gathered data was then visualized, transforming student activity into a dynamic representation.

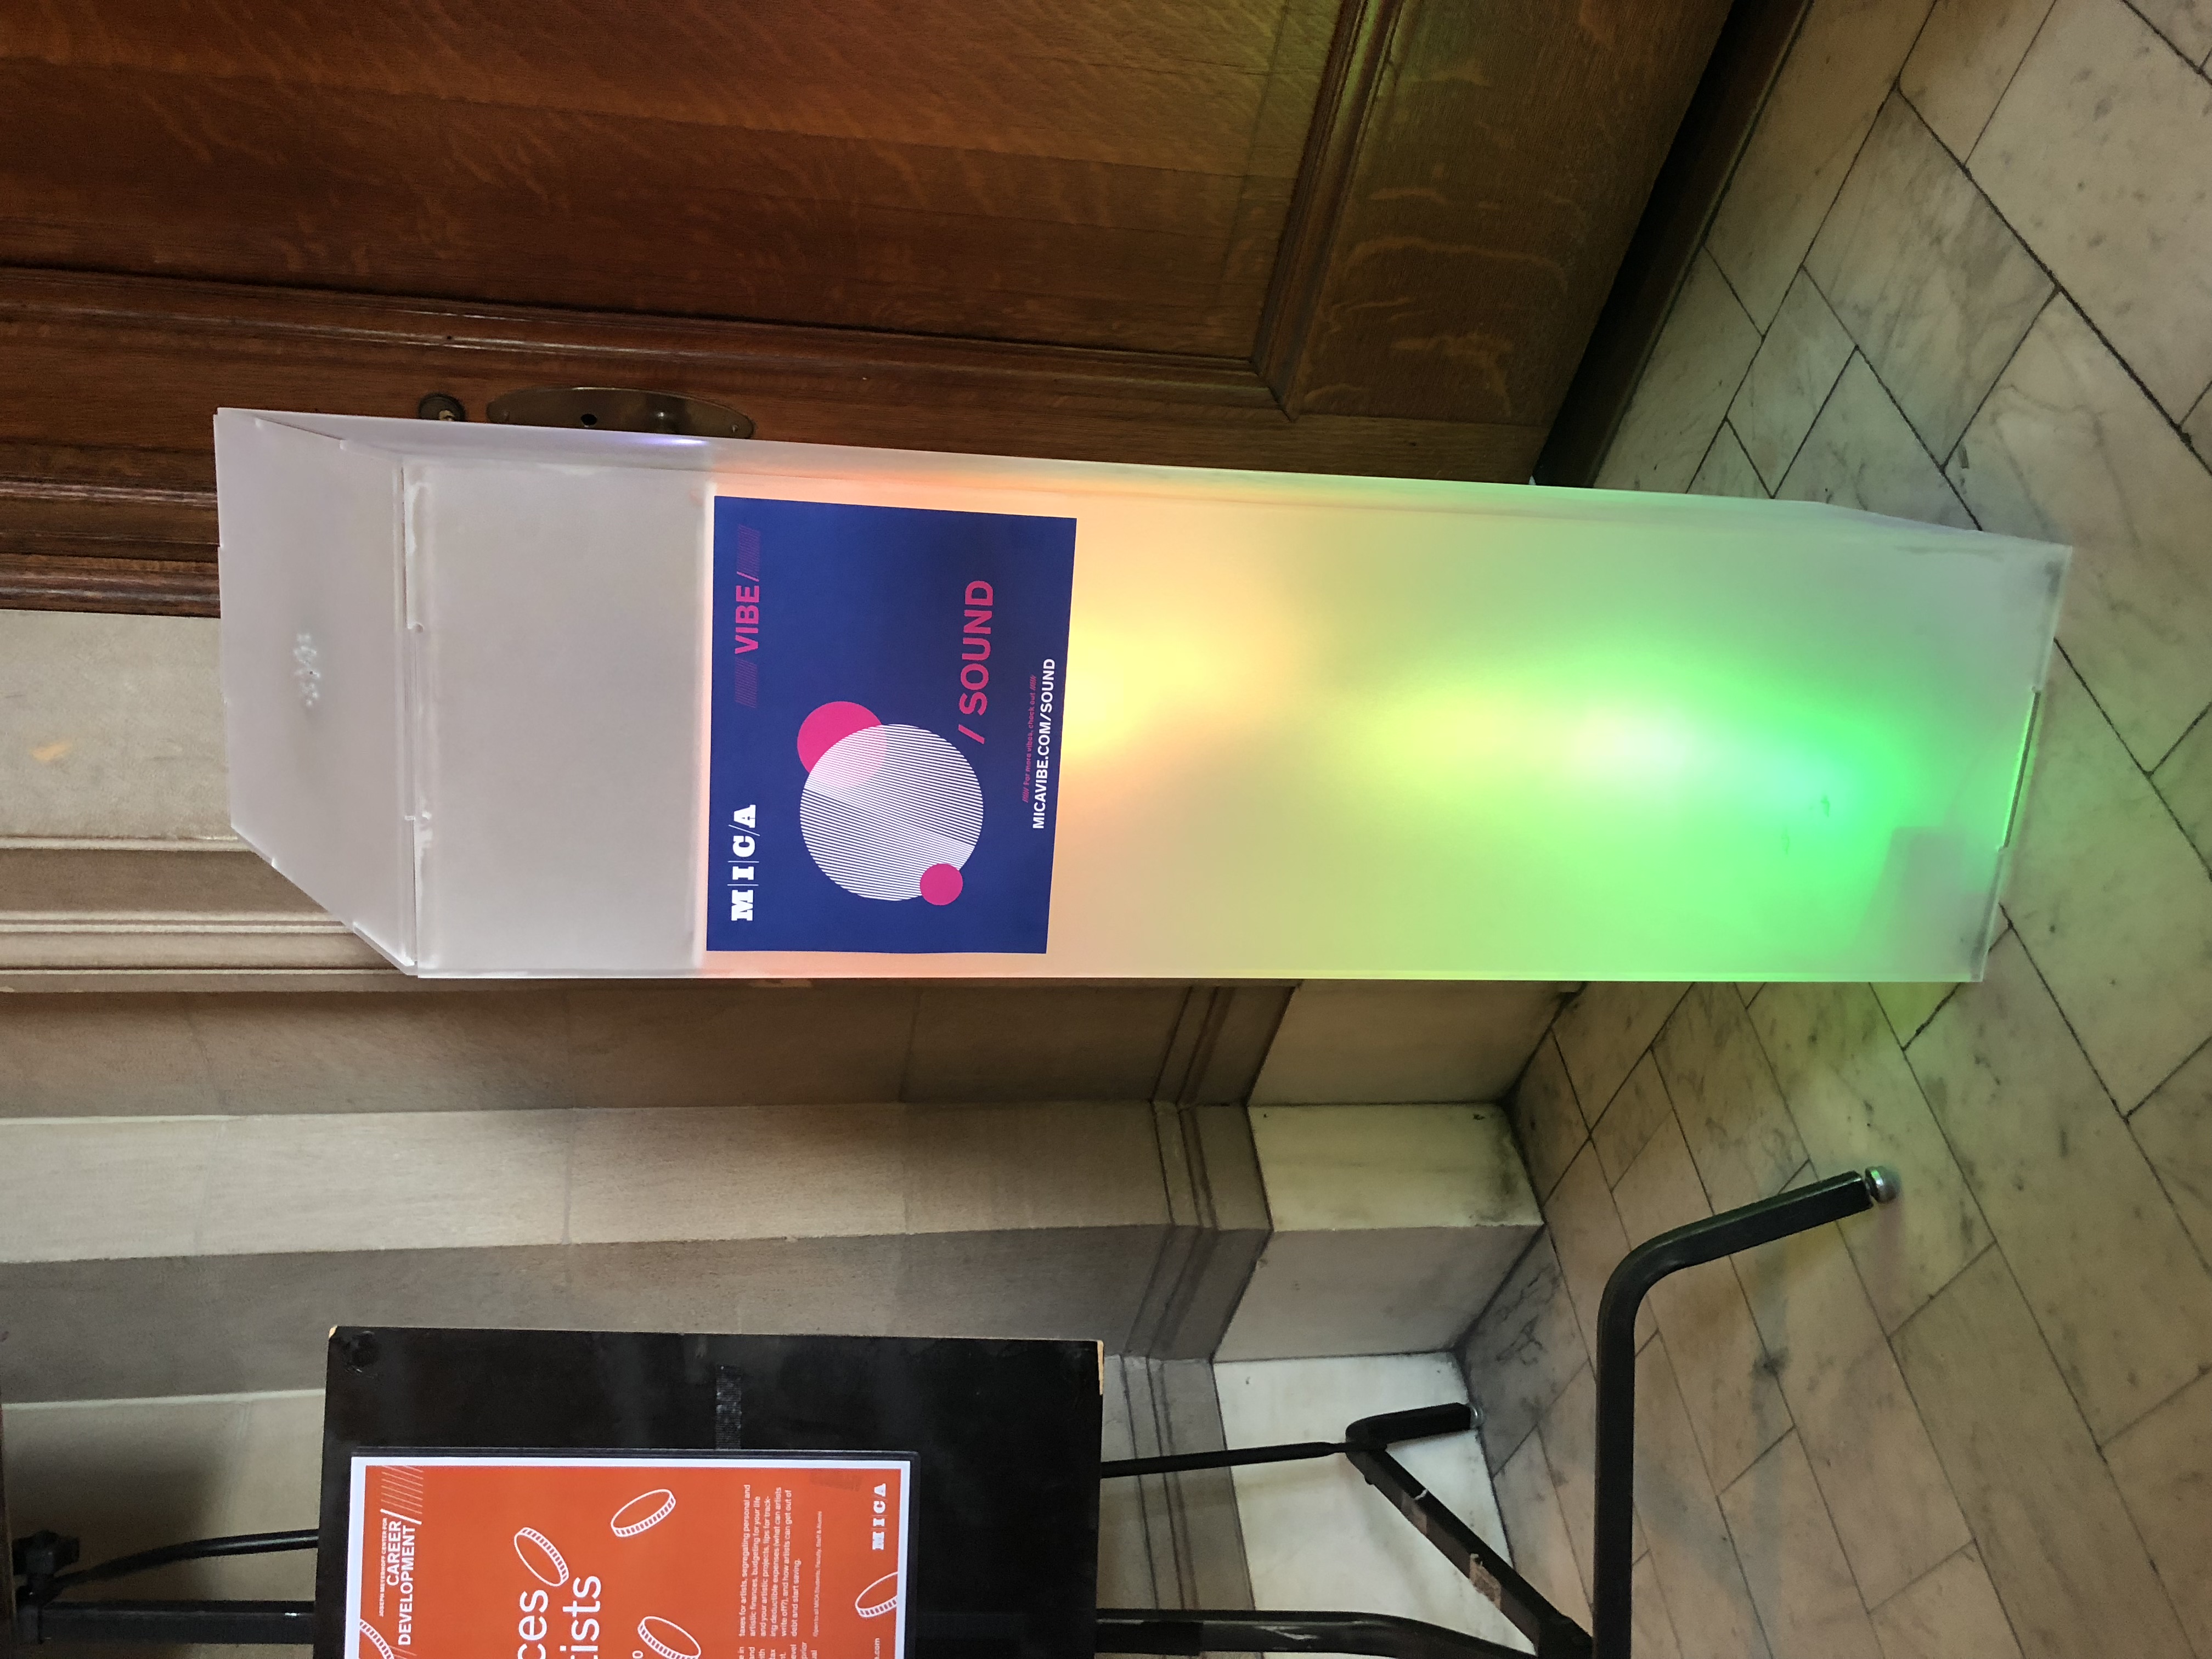
Sound Station
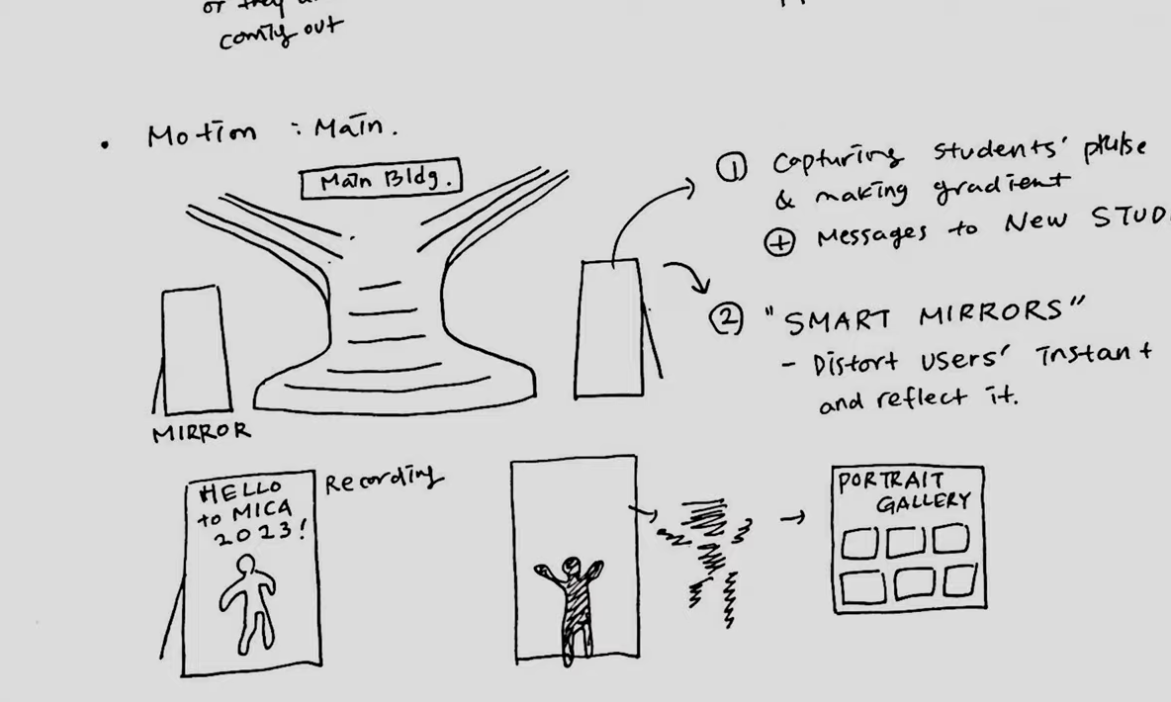
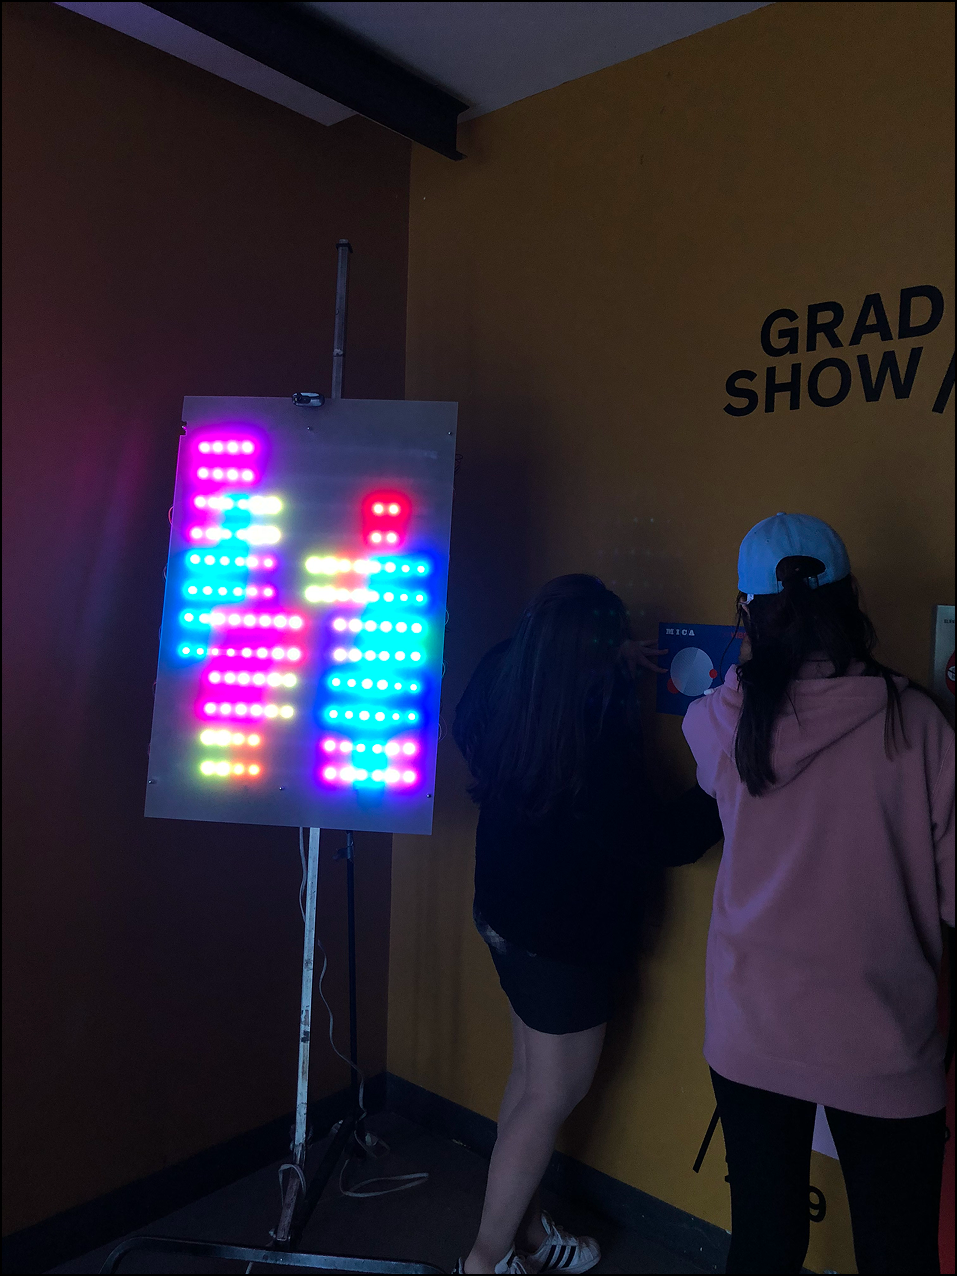
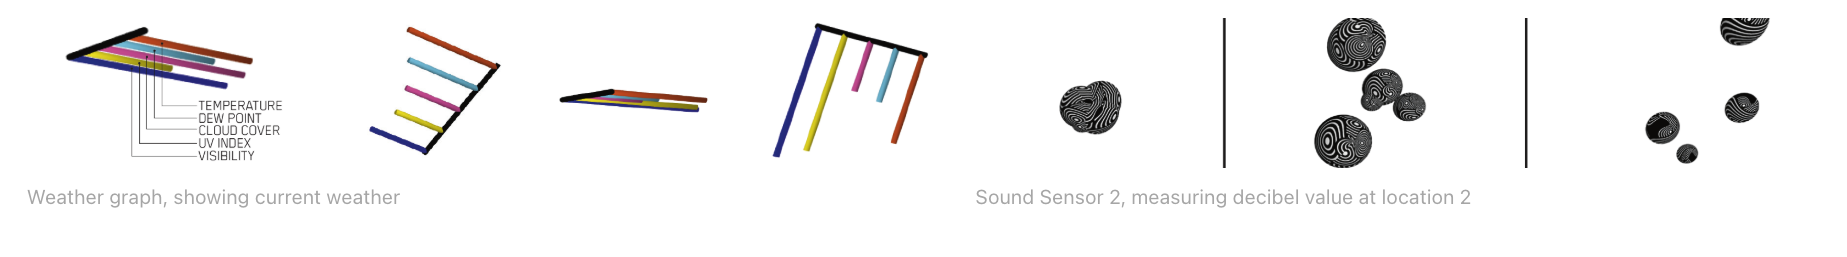
The sound station was installed in the main building, where Fine Art students primarily study. It captured and measured all sounds in decibels, from ambient noise to the smallest actions of passing students. The collected data was then visualized as part of the MICA Vibe project.
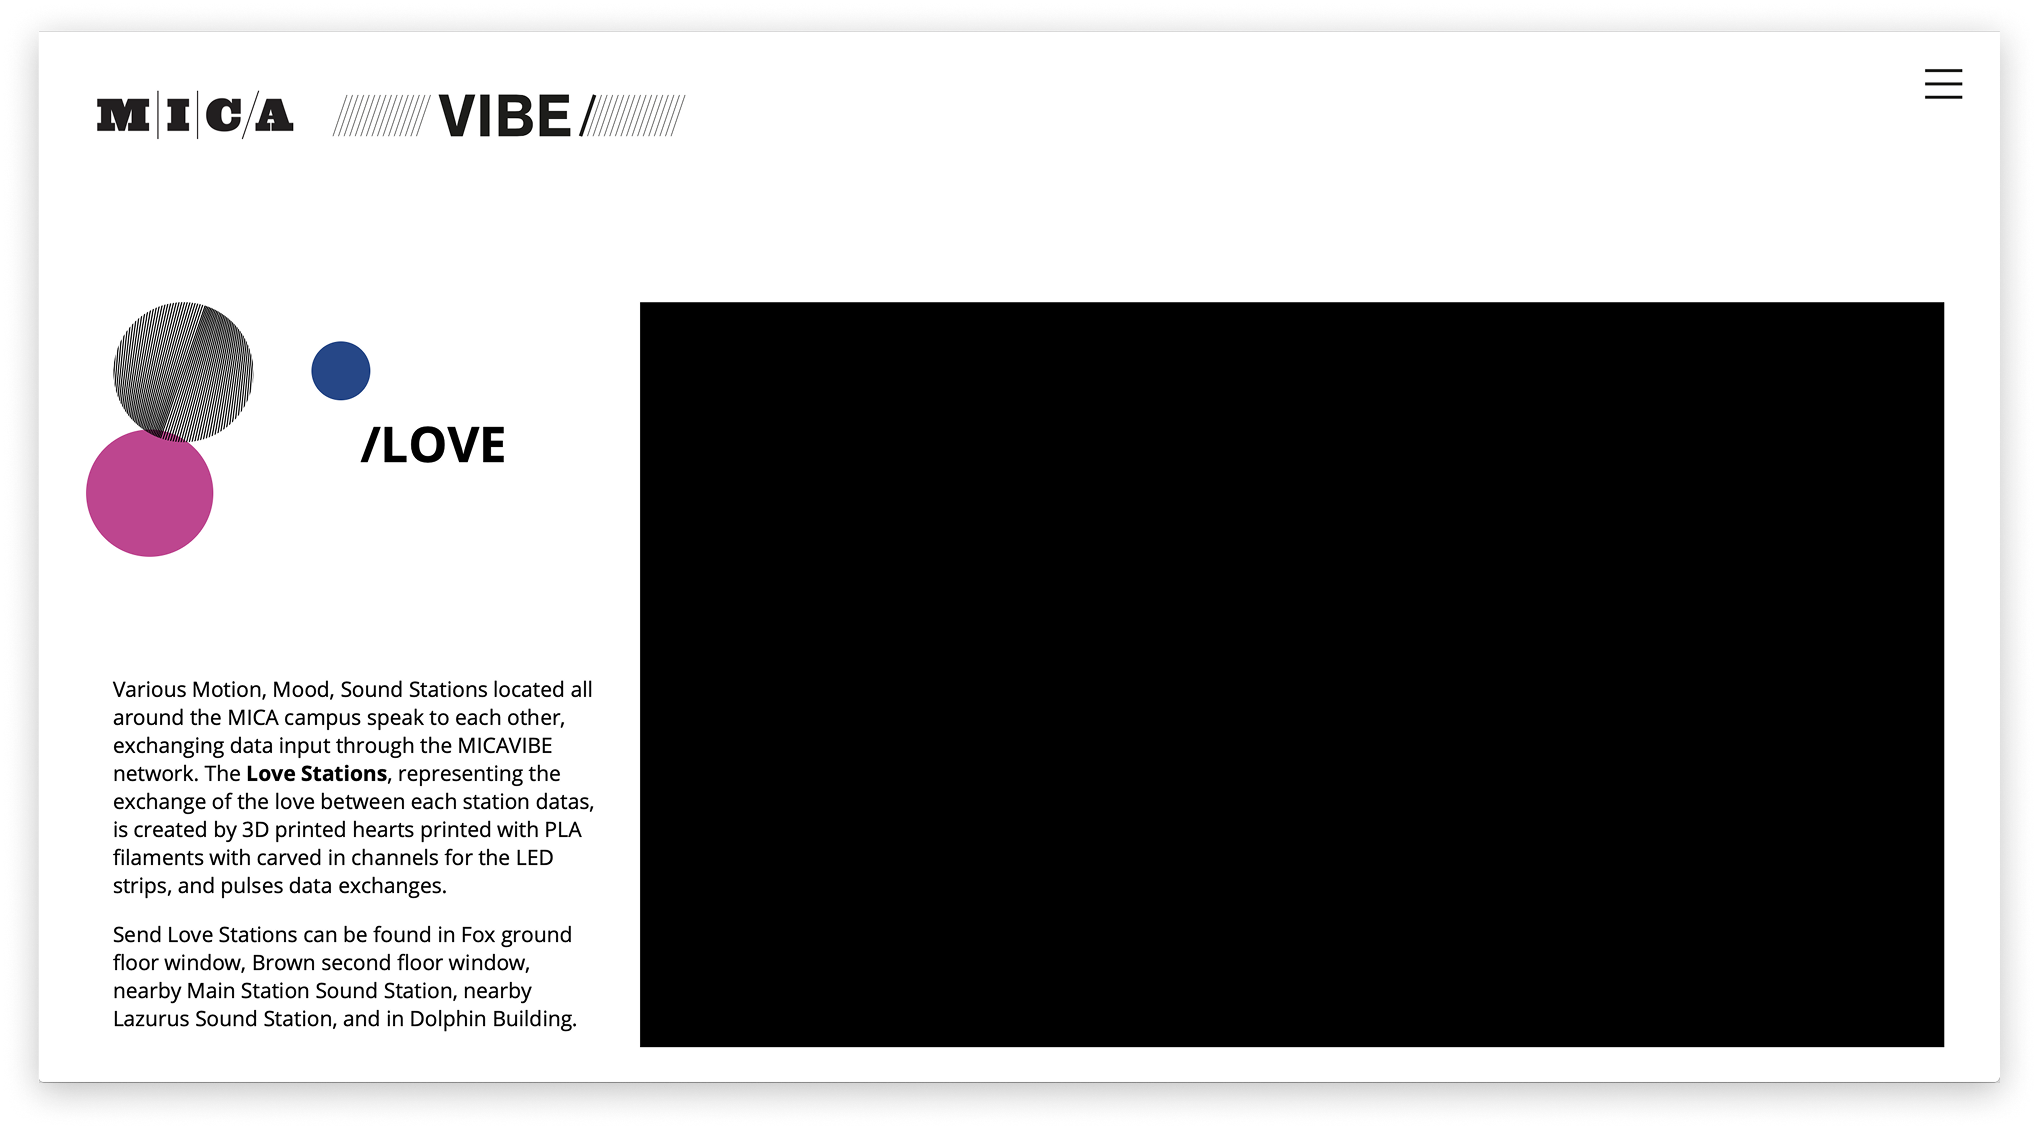
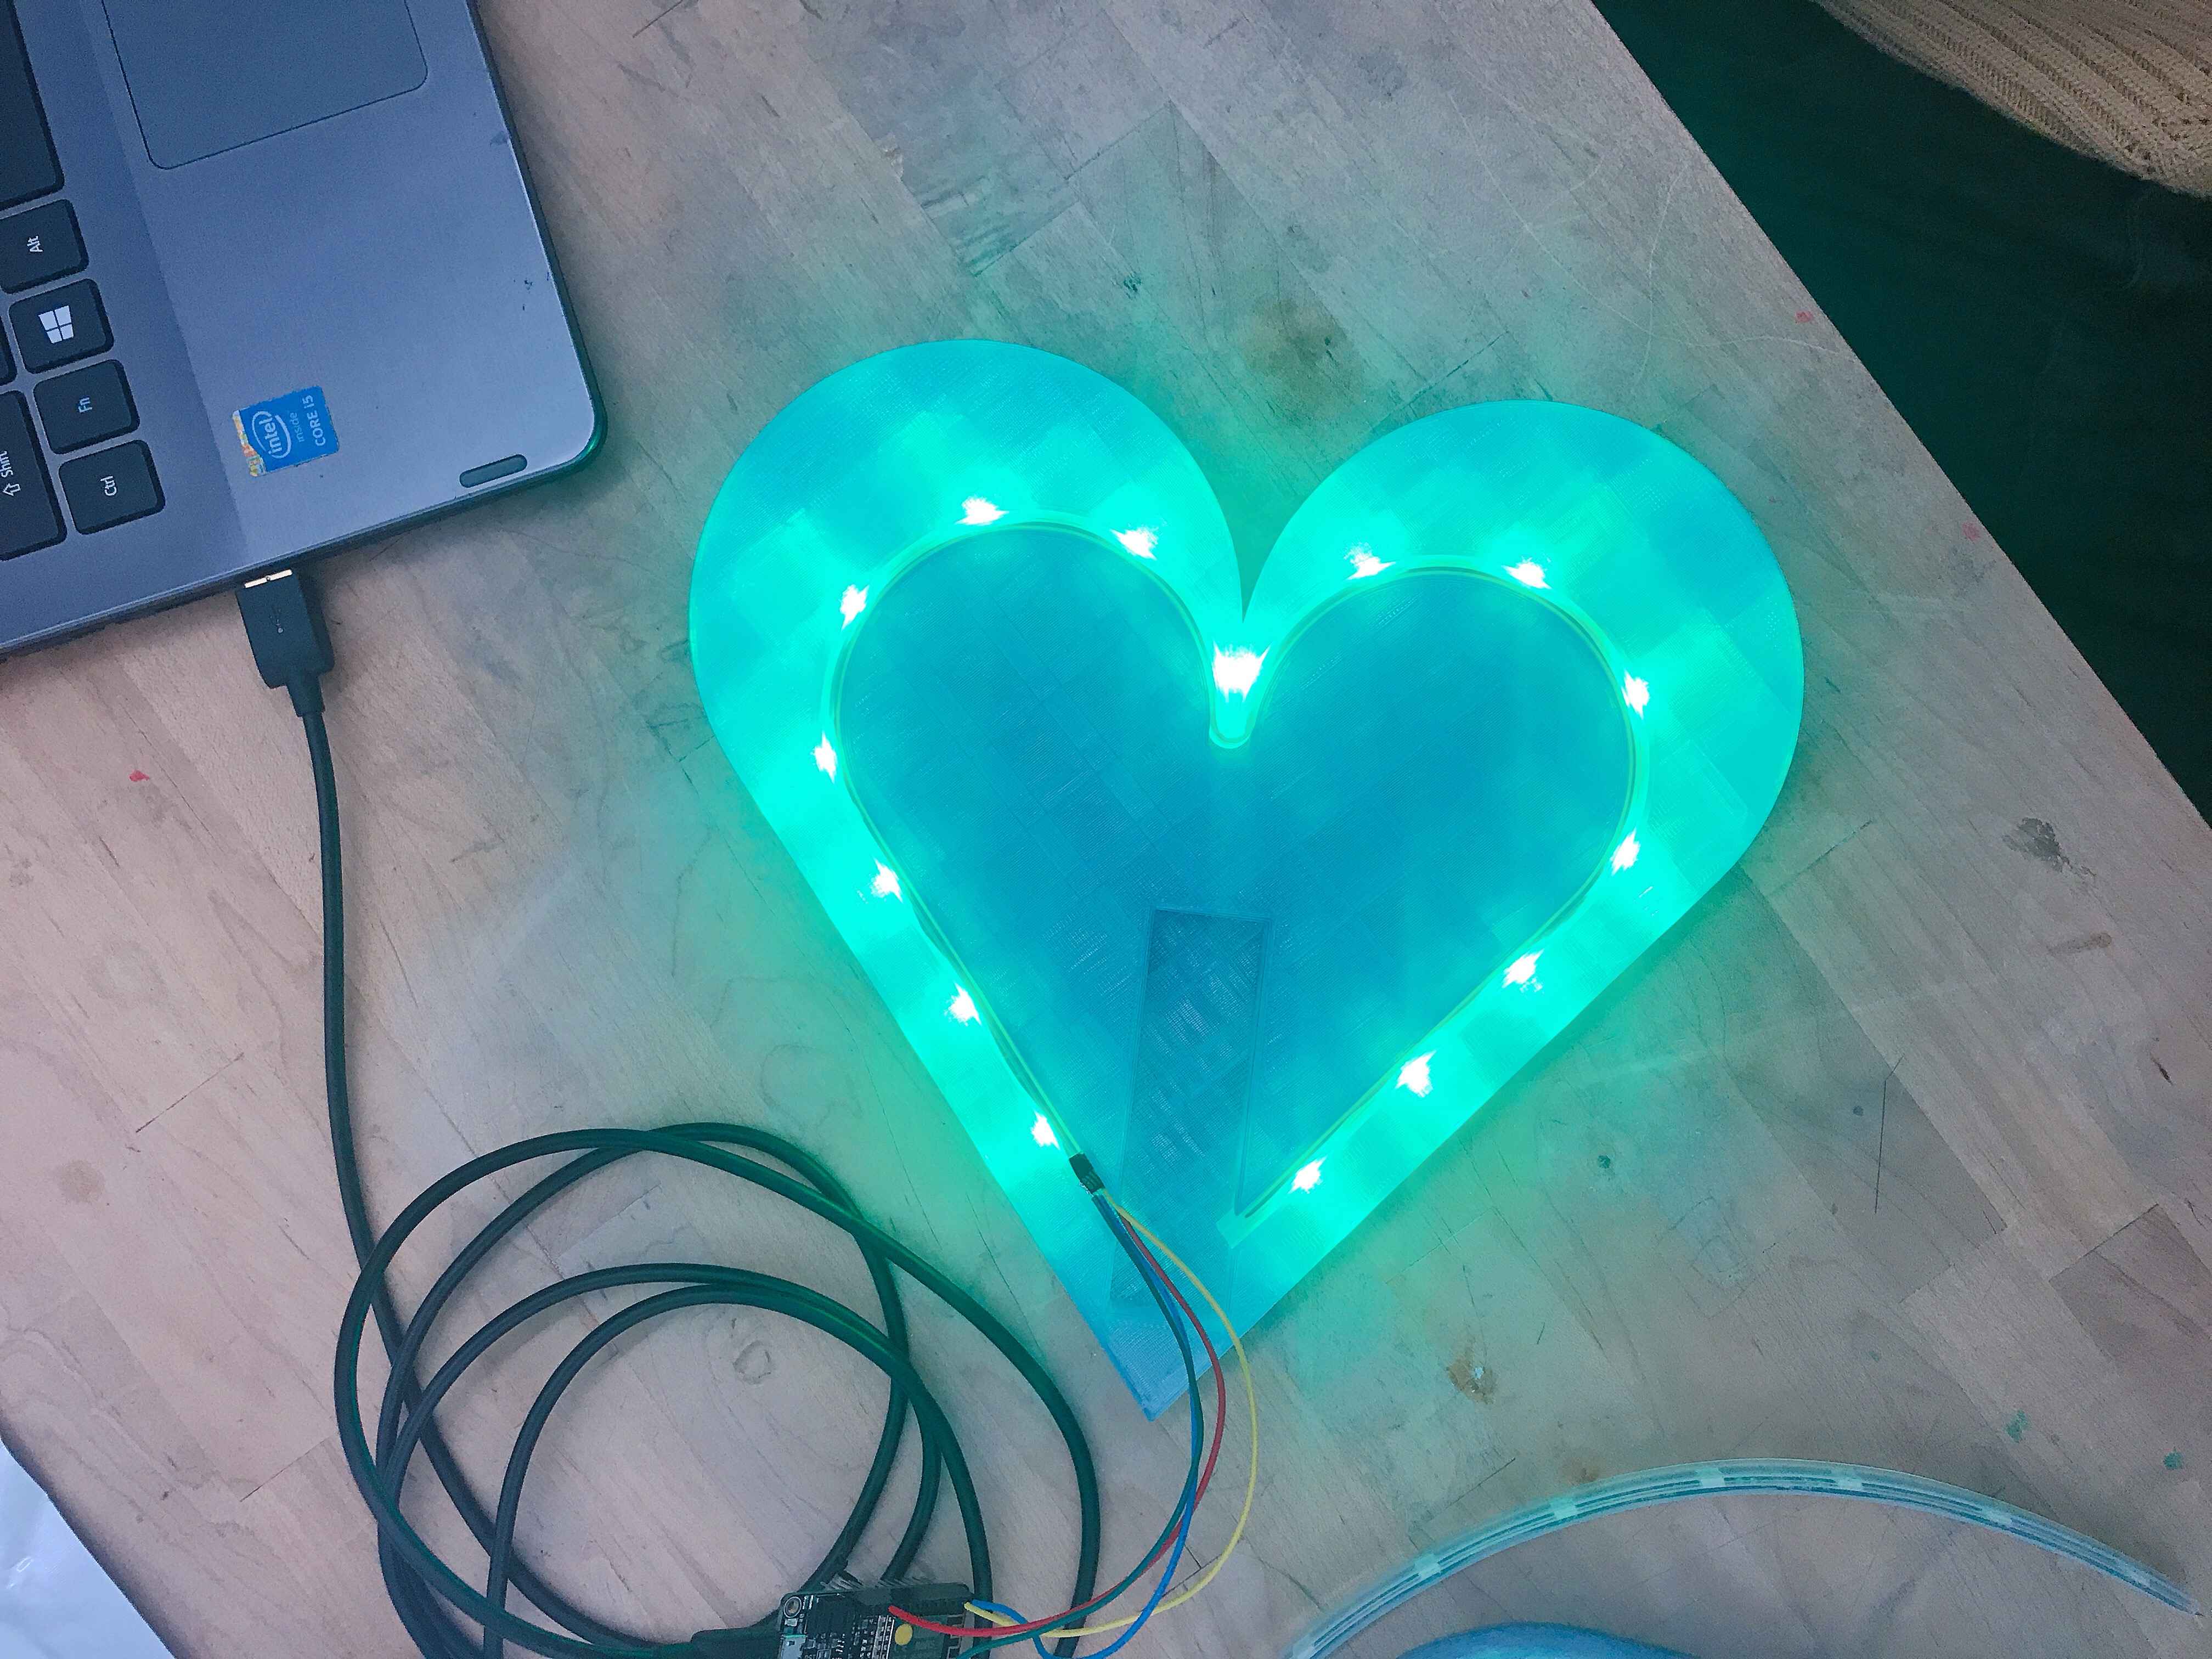
Love Station
The love station, representing the exchange of the love between each station datas, is created by 3D printed hearts printed with PLA filaments with carved in channels for the LED strips, and pulses data exchanges. Send Love Stations can be found in Fox ground floor window, Brown second floor window, nearby Main Station Sound Station, nearby Lazurus Sound Station, and in Dolphin Building.

Process
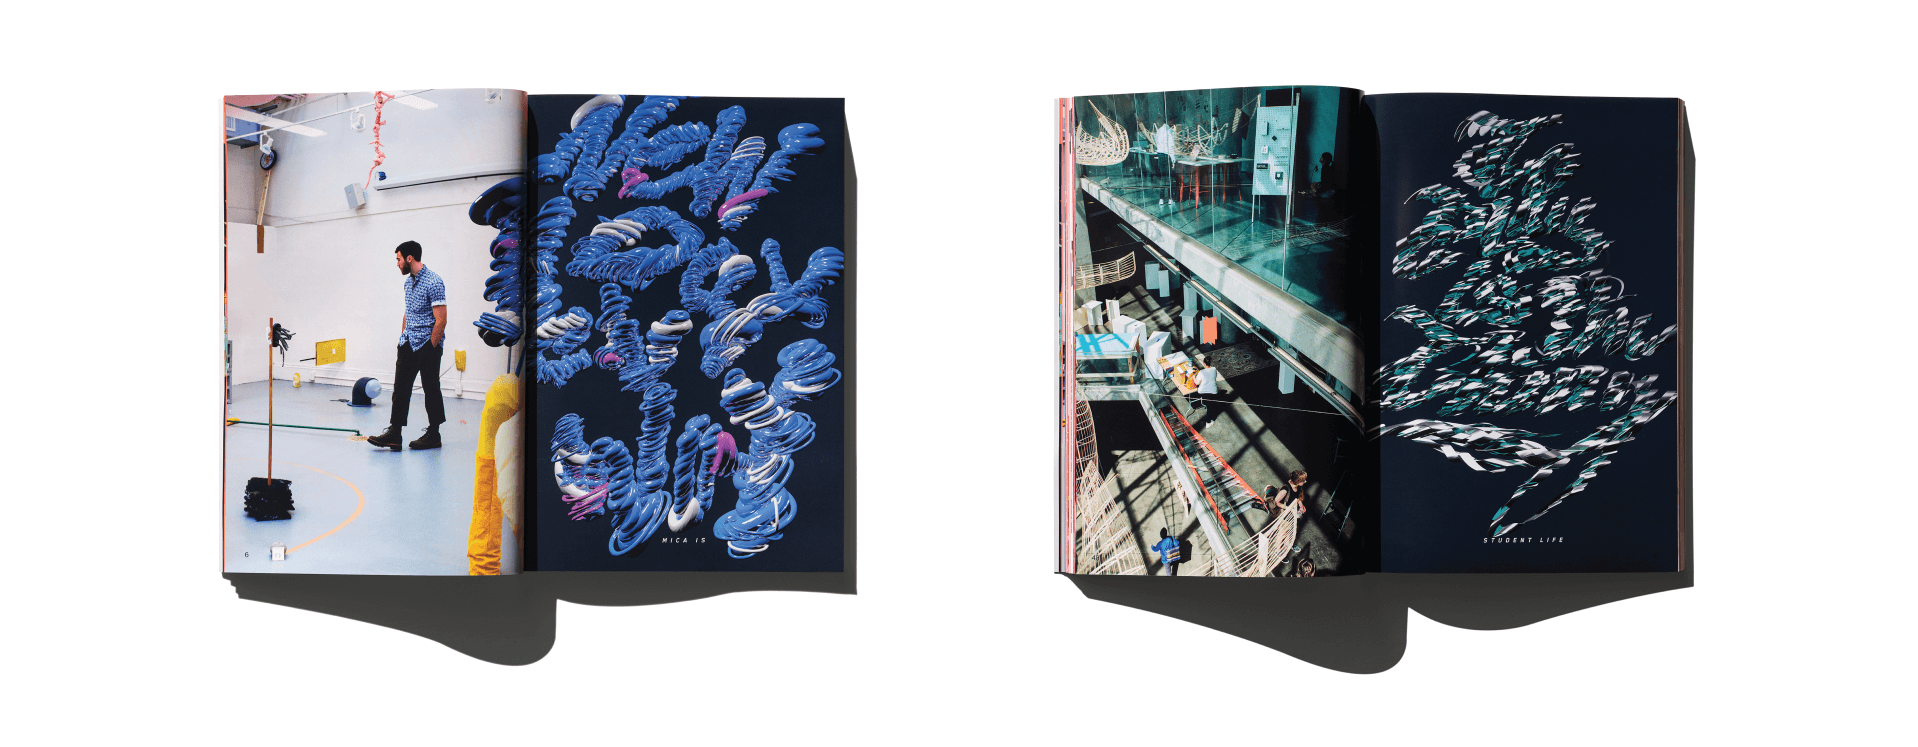
Book Covers
After collecting the data, we began visualizing the results and translating them into graphic expressions.
The data sets from each station were used as the foundation for designing a series of book covers,
treating data as both material and narrative.
Final output
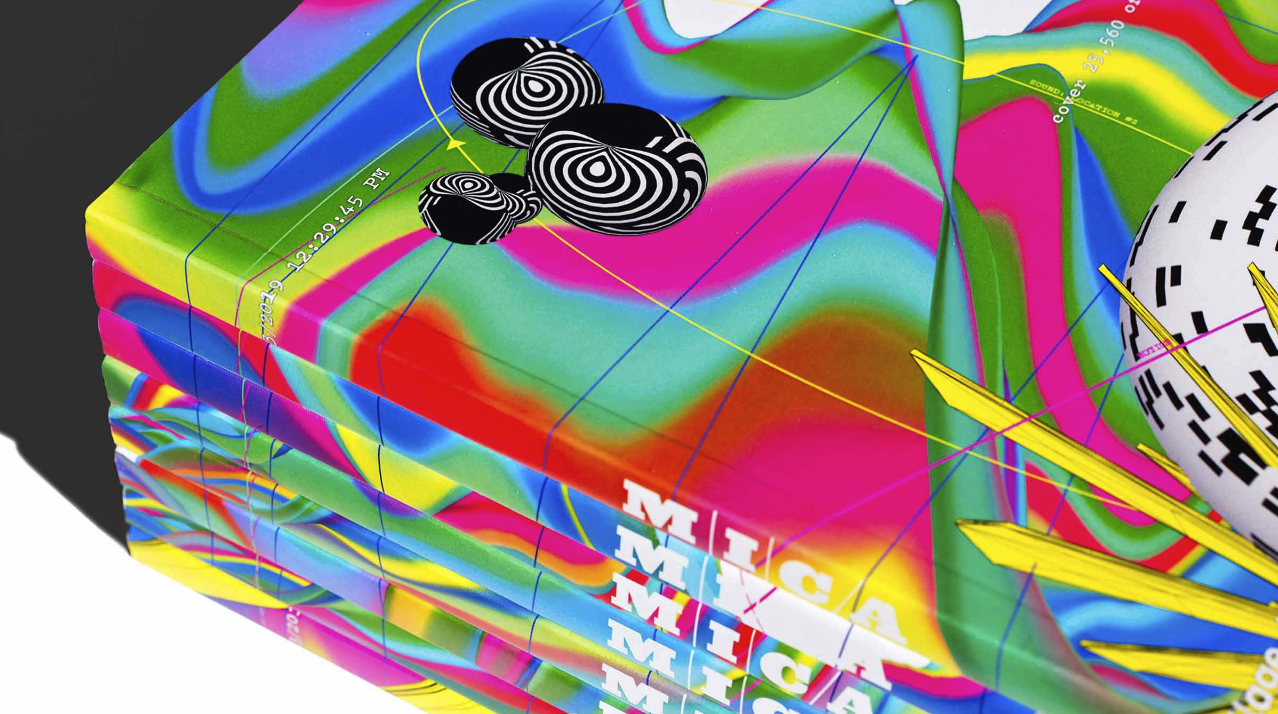
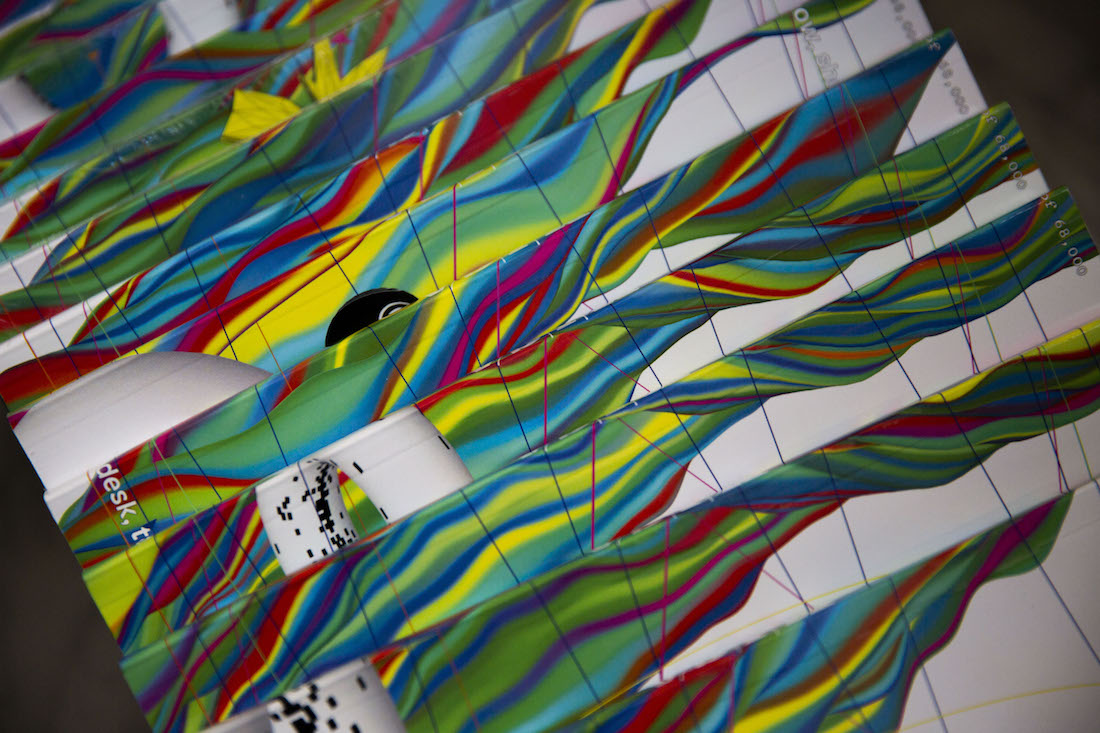
Book Design
The collected data was transformed into visual systems that generated 68,000 unique book covers for the Maryland Institute College of Art Prospectus. Each cover used the Mood, Sound, Motion, and Love data as graphic inputs — resulting in a publication where every copy reflected a different student’s interactions.
Format: 200 pages / Size: 6.5” x 9.25” / Output: 68,000 unique book covers (data-driven)